Lattice panel function for confidence intervals with capped bars
panel.2cat.RdThis panel function is defined to plot confidence intervals in a multi-panel
lattice display where the x-variable is categorical. Note, both lower and
upper must be passed directly to xyplot as they will be passed down
to the panel function.
panel.2cat(x, y, subscripts, lower, upper, length = 0.2)
Arguments
| x, y | Data from the call to |
|---|---|
| subscripts | Variable used to created the juxtaposed panels. |
| lower, upper | 95% lower and upper bounds of |
| length | Length of the arrow head lines. |
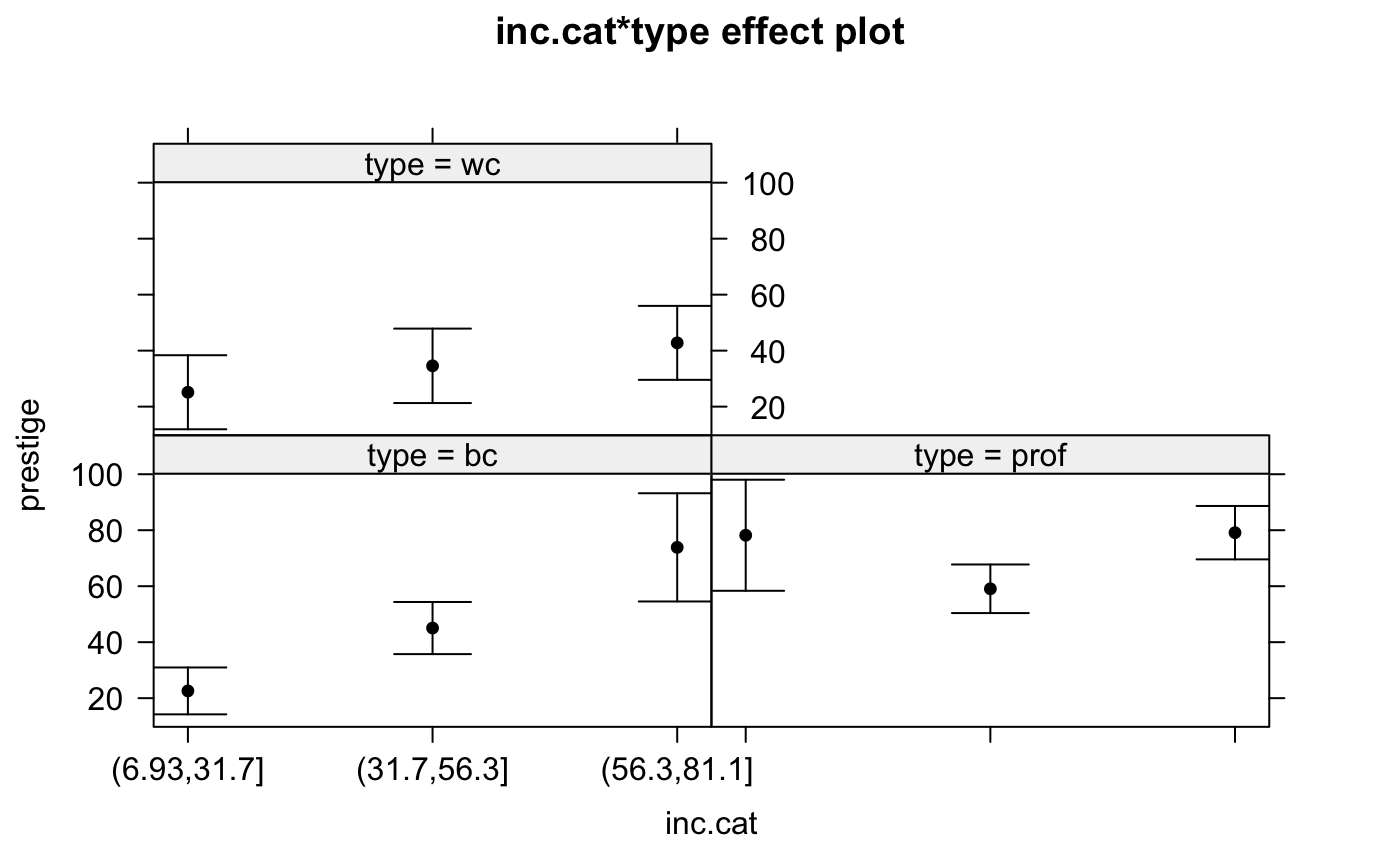
Examples
library(lattice)
library(effects)
data(Duncan, package="carData")
Duncan$inc.cat <- cut(Duncan$income, 3)
mod <- lm(prestige~ inc.cat * type + education,
  data=Duncan)
e1 <- effect("inc.cat*type", mod)
update(plot(e1), panel=panel.2cat)